Reverse Osmosis vs. Activated Carbon: Why Carbon Fails on Lead, Fluoride & PFAS
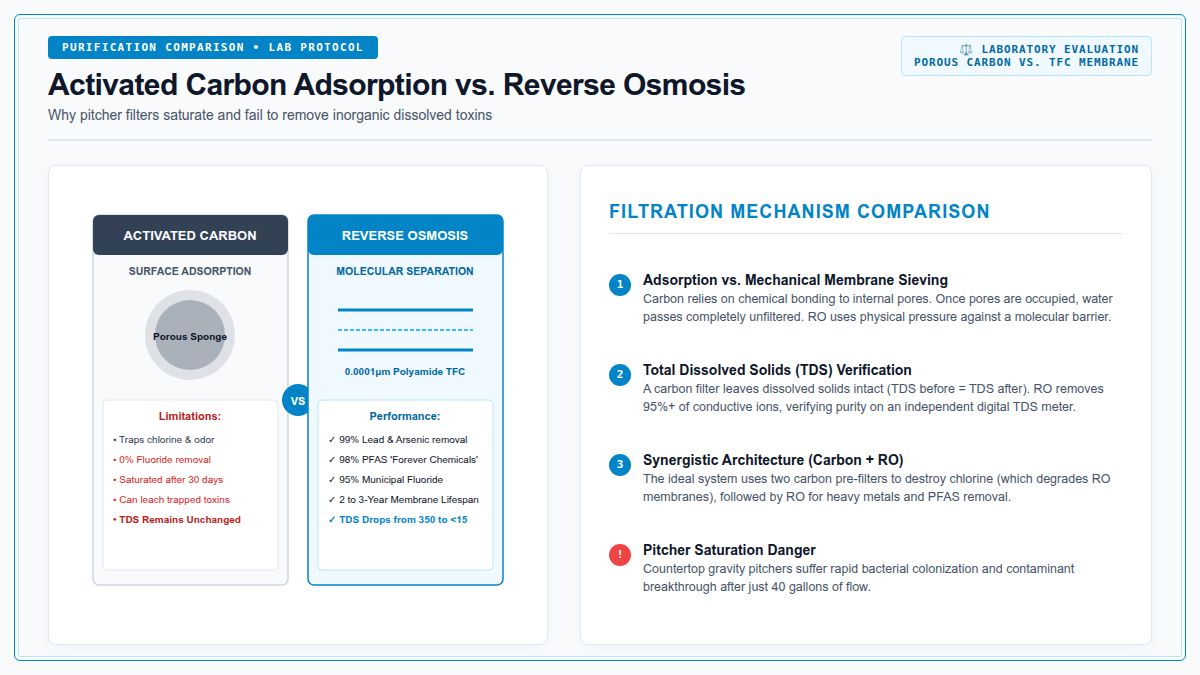
Most American households rely on countertop carbon pitchers under the mistaken belief that tasting less chlorine equals drinking pure water. Activated carbon is an extraordinary sponge for organic chemicals and aesthetic chlorine, but it possesses zero physical capacity to reject dissolved ionic heavy metals, fluoride, or persistent low-molecular-weight PFAS. Only high-pressure reverse osmosis membranes operate at the 0.0001-micron scale necessary to purge inorganic dissolved toxins.
1. The Physics of Carbon Adsorption: An Exhaustible Porous Sponge
Activated carbon filters are manufactured by heating coconut shells, coal, or wood to high temperatures, creating millions of microscopic pores. When water flows through, chlorine molecules and volatile organic compounds (VOCs) are attracted to the carbon's carbonaceous surface through Van der Waals forces.
However, this process is purely adsorptive, not a physical barrier. As water continuously passes, available pore sites become saturated. Once saturated (typically within 30 to 45 days in average municipal tap water), the filter experiences breakthrough: water flows straight through completely unpurified, and trapped bacteria can begin colonizing the stagnant carbon bed.
2. The Reverse Osmosis Barrier: 0.0001-Micron Steric Rejection
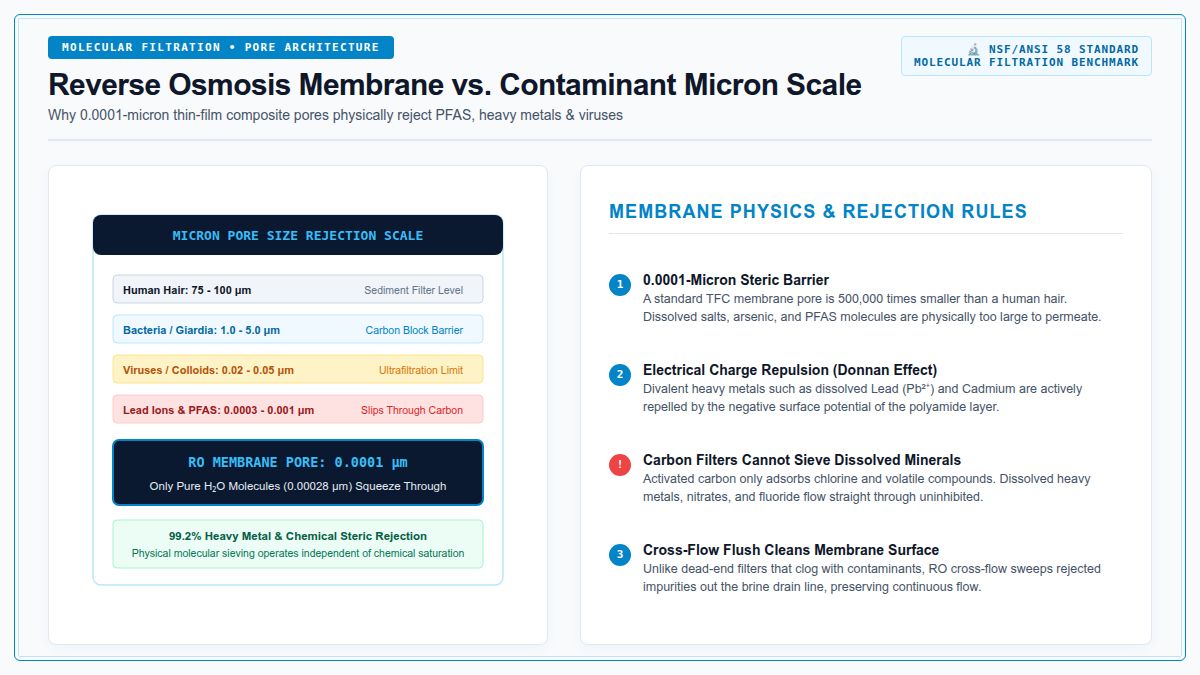
Reverse osmosis does not rely on chemical adsorption. Instead, municipal water pressure (typically 50 to 60 PSI) forces water molecules across a semipermeable Thin-Film Composite (TFC) sheet made of synthetic polyamide.
The pores in a TFC membrane measure approximately 0.0001 microns (0.1 nanometers). For scale, a single dissolved lead ion (Pb²⁺) measures approximately 0.0003 microns, and perfluorooctanoic acid (PFOA) measures 0.001 to 0.002 microns. These contaminants are physically incapable of penetrating the membrane pores and are continuously flushed away down the brine drain line.
3. Contaminant Removal Verification: Lab Test Data
| Contaminant | Standard Carbon Pitcher | Under-Sink 5-Stage RO | Removal Mechanism |
|---|---|---|---|
| Chlorine Taste & Odor | 95% - 99% | 99.9% | Carbon Pre-Filter Catalysis |
| Dissolved Lead (Pb²⁺) | < 20% (Fails) | 98.5% - 99.2% | Charge Repulsion & Pore Barrier |
| PFAS / PFOA Forever Chemicals | 40% - 60% (Rapid Saturation) | 98.0% - 99.4% | 0.0001μm Steric Rejection |
| Municipal Fluoride | 0% (Ineffective) | 92.0% - 96.0% | Ionic Filtration Barrier |
| Total Dissolved Solids (TDS) | 0% Reduction | 95% - 98% Reduction | Polyamide Thin-Film Composite |
Remineralizing Reverse Osmosis Water: Restoring Essential Magnesium & Balancing Alkaline pH
TDS Membrane Rejection Efficiency & Filter Lifespan Specifier
Measure your membrane's physical rejection efficiency using raw feed TDS versus pure permeate TDS. Real-time diagnostics calculate exact membrane health, pore integrity, and scheduled filter cartridge replacements.